

Road Code
An all-inclusive professional cycling platform featuring an interactive Race Centre, a Fantasy Game and a revolutionary new Ranking System


ROLE
UX Designer
COMPANY
Immortal
DATE
2023-2024
TYPE
Desktop (Responsive)
Professional cycling is a beautiful mess 🚴♂️
Professional cycling is where the chaos of unpredictable races, dynamic team strategies, and the diverse landscapes create a thrilling spectacle. The sport's complexity and passion shine through despite occasional confusion and disorganization.
Enter the Road Code project: a revolutionary platform designed to streamline the experience of cycling fans and participants alike. Road Code aims to bring clarity and engagement to the world of cycling by offering comprehensive tools for race tracking, fantasy games, and detailed rider information, making the sport's vibrant chaos more accessible and enjoyable for everyone.
THE CHALLENGE
Engaging new & existing fans in the complex world of cycling.
THE OPPORTUNITY
Expanding reach with an intuitive, all-in-one cycling platform.
Final Prototype for the Race Centre
Initial assumptions
🧩 There are too many fragmented information sources.
Cycling fans often have to visit multiple websites and apps to find race updates, rankings, fantasy leagues, and video content. A single platform like Road Code could simplify this experience by centralizing all cycling-related information in one place.
🔥 There is a growing interest in cycling.
With global interest in cycling surging, partly fueled by documentaries like Netflix’s Unchained, there's a demand for a platform that caters to both hardcore fans and new followers, making it easier to engage with and understand the sport.
🤌 Current platforms lack personalization features.
Current platforms often provide generic content that doesn’t cater to individual preferences or viewing habits. Road Code could offer personalized experiences, such as tailored race recommendations, custom fantasy league settings, and content based on user interests, to keep both new and seasoned fans more engaged.
Understanding the Professional cycling world
I conducted some market research of existing professional cycling platforms in order to better understand what we could do better. Below are some examples of where pro cycling is currently at, from a visual perspective.


So, who is our target audience?
It was vital to narrow down who are pro cycling fans and who within our larger audience we could impact.
The Fans
The typical fan of pro cycling is a male, between 25-45 years old, from UK, US, Australia and other English speaking countries.
The Audience
Our audience is composed primarily of the over 60's from central European countries and 35-55 year old stay-at-home women.
Who do we design for?
01 / The Fan 📣
A highly engaged male, aged 25-45, from the US, UK, or Australia, who actively seeks out detailed cycling news, follows races for both strategy and sport, and participates in fantasy leagues and niche platforms like Road Code.
02 / The Pensioner 🏠
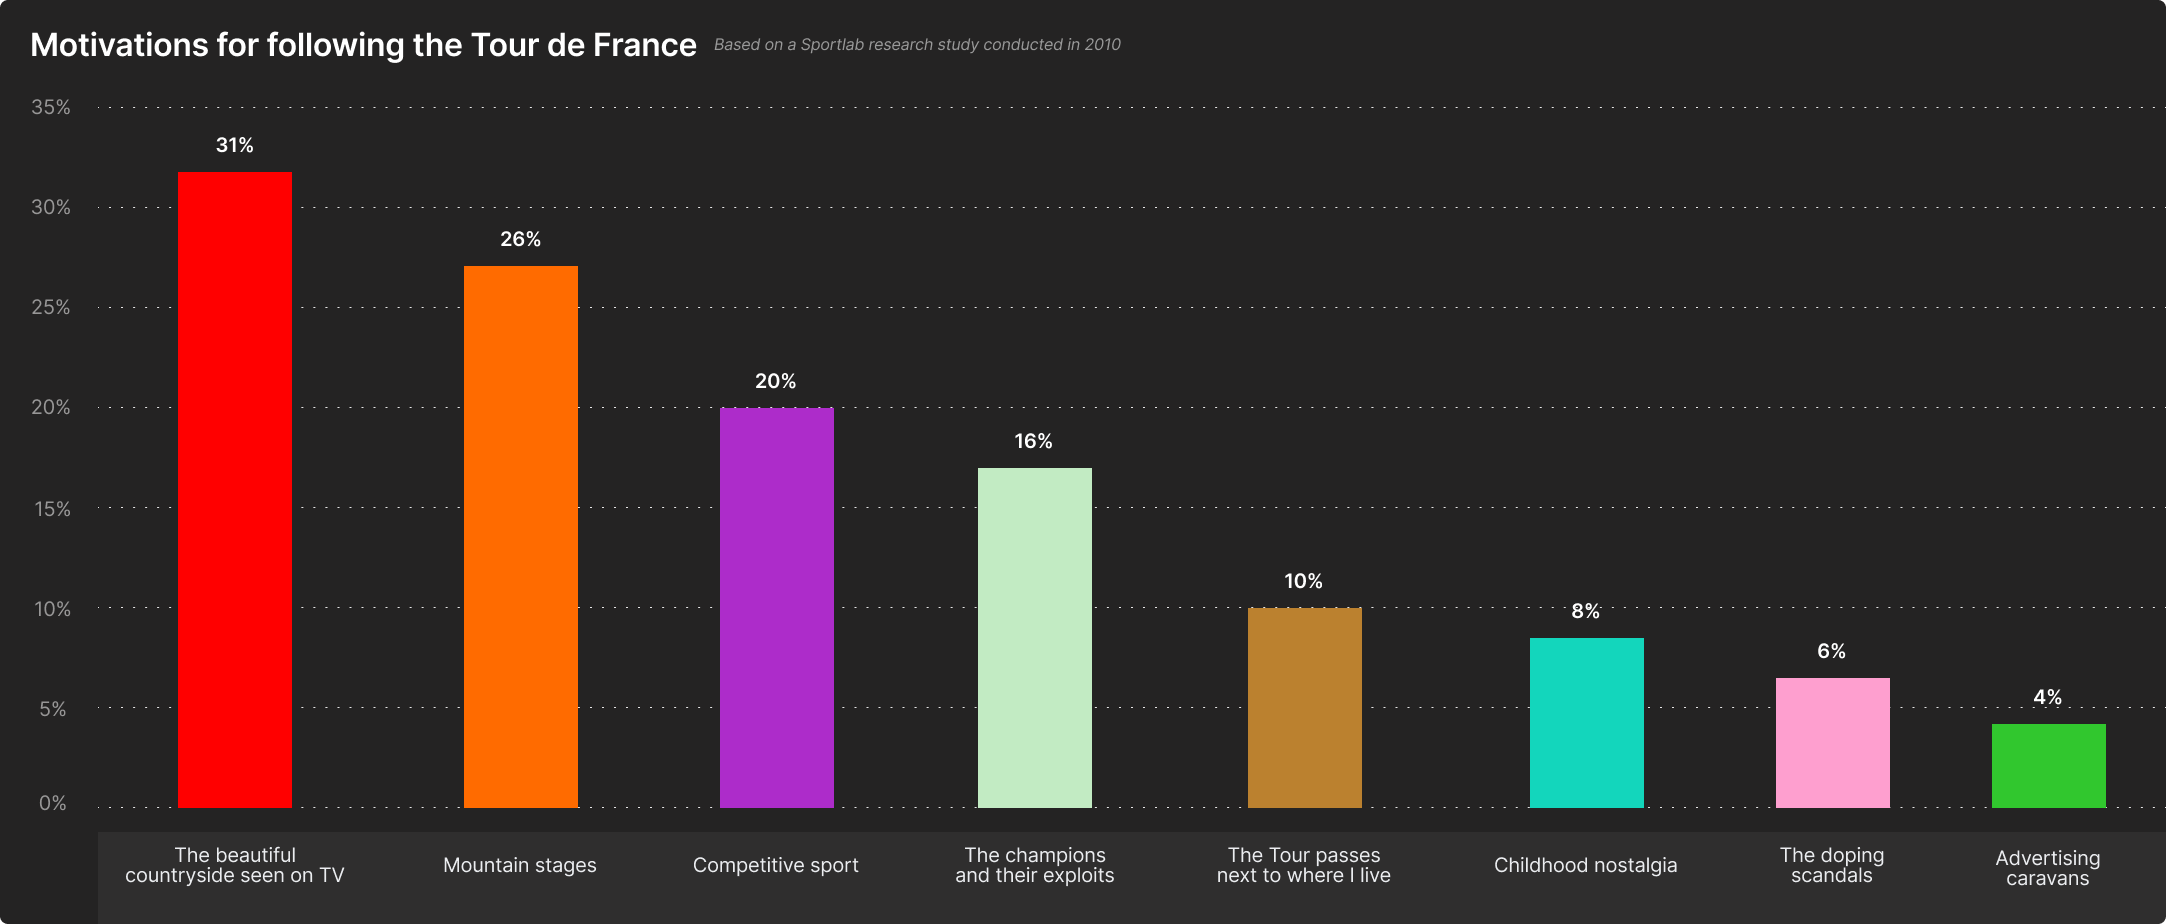
A 60+ European casual viewer, primarily from central Europe who watches mid-afternoon races like the Tour de France for the scenic beauty, prefers traditional TV coverage, and has low engagement with interactive platforms or detailed content.
03 / The Housewife 💁♀️
A female, aged 35-55, from a European country with a strong cycling culture, who watches races during weekday afternoons for both the sport and scenery, follows major events, and enjoys the spectacle but is less engaged with specialized content.
04 / The Belgian 🇧🇪
A cycling enthusiast from Belgium, of any age, deeply knowledgeable and passionate about the sport, follows every race, knows the riders and tactics well, and actively engages in discussions, fantasy leagues, and local cycling communities.


Leading the research & design of the Race Centre feature 🕹️
Mapping out user journeys and the navigation
I used our personas as guidance to draw up various user journey scenarios and create an initial sitemap of the Race Centre.


Creating LoFi & HiFi Wireframes and a Prototype
I developed LoFi & HiFi wireframes to sketch out some designs. I then reiterated on those designs with feedback from the Subject Matter Expert and created a high fidelity prototype divided by different usability tasks that would be used for user testing.


Cross-collaborating to set up User Testing
I coordinated with our Marketing & SoMe departments to send out email blasts and Discord announcements inviting users for a User Testing opportunity.

Conducting the interviews and synthesizing the insights
I scheduled and conducted 5 user interviews. I transcribed and collected the insights into an affinity map.


How can it be improved based on user feedback?
Below you can find some of the revisions based on the usability testing insights.

The standings and stages tabs need to be combined to make sense.
4 out of 5 users were confused or expected to find the standings directly within the stages. It should also include details on jersey winners and riders who have abandoned the race.

The "riders" tab needs more clarity.
There was confusion amongst users about the purpose of the "Riders" tab, with users unclear that it was essentially a startlist of all riders, rather than the participants of a specific stage.

The feature needed simplification in terms of navigation.
The separate "Live" tab in the main navigation would be empty most of the time. By removing that extra top layer of navigation there is less "options" for the users to get lost in.

Including detailed keypoint and group information.
All the users mentioned how being able to see more details about specific keypoints is important. Users want to be able to filter and see details about jersey holders, favorites, and abandoned riders within group data.

An easily accessible Rider Profile that users can easily navigate to.
Users expected to be able to tap on a rider and get some more information about them. This included their strengths and abilities, their most recent results, seasonal results, etc.

Users want a summary of previous stages and contextual race information.
All users expressed frustration about the lack of documented information on race locations and want more context and history about these places, highlighting monuments and attractions. They also want to be able to go to a finished stage and get an overview of the results.
The Solution 💡
Problem 01
Not being able to see the overall and stage results without having to switch tabs.
Solution
Combining the stages and standings tab into one.
Users easily switch between overall and stage results per stage, and easily compare within one screen.
Problem 02
Not being able to easily find a startlist of all the riders participating in a race.
Solution
Renaming the old riders tab into startlist and adding an extra layer of team details.
Users can easily check which riders are starting and get in depth information about the teams.
Problem 03
Not being able to navigate easily to see stage summaries and upcoming stages.
Solution
Using a banner to find the live race and chips that allows users to switch between stages.
The user can easily find the current live stage with the button in the banner and the chips allow for quick navigation.
Problem 04
Wanting to see more detailed group, rider and keypoint information as well as race context.
Solution
Creating a more interactive stage profile by using pop-ups.
Users can tap on the stage profile or on the group and riders in order to see more details. They can also tap on a place in the tourism section to learn about the context.
Final thoughts
Learnings
⚖️ Striking a balance between not enough and too much.
Due to its complexity, pro cycling has an inherently high barrier to entry for new users. It was my responsibility and priority to be able to create features that would engage both existing cycling fans and new ones that might be interested. This was tricky, as it required being able to step back, do small tests of designs and analyse those responses.
💡 Testing on a small budget is better than no testing.
The platform was already existing by the time I arrived as a UX designer, but no form of user testing had taken place beforehand. While it was challenging to establish this flow due to time and budget constraints, the insights I was able to gather led to much needed improvements within the platform.
Next Steps
🎨 Handover to UI.
The following steps would require finalizing some flows and handing over to the UI designer.
🚀 Handover to developers.
After the finished UI, we would handover the final screens to the developers and collaborate with them in order to make sure everything is clear.
Selected Works

Pass To WinA Social & Collaborative Football Community

PickleA Recipe App To Help Eliminate Food Waste

iOS WeatherAdding A Personalized Notification Feature

VCorp Latin AmericaA Small Business With A New Identity

ZeitAn Innovative Way To (Time) Travel

South Carolina VillaResidential House Project For A Growing Family

2 Finsbury AvenueSustainability Research & Strategy For An Iconic Tower

Shenzhen Natural History MuseumAward Winning Museum With A Holistic Sustainability Strategy

Reinventing Cities, MilanDesigning A Masterplan That Fosters Community & Wellbeing